So I track the hits on this page, you know, all that little stuff down to the color of “insert very personal clothing item name here” you were wearing when you got on this page – just kidding. Breathe in. Anyway, among the stats that I pay attention to are: the number of hits, the region of origin and the blog retention rate.

The chart above indicates the number of hits/ our retention. The plotting is done on a week-by-week basis and among the points of interest are the spikes at W31, W34, W38 and so on. These correspond to periods following our major events such as meetings and stuff – makes sense as this is when we would usually send a nice little email saying that the pictures and event update are available on the blog (quite the sleazy way of stuffing the ballot box and getting more “hits” on the blog)

The pie chart above breaks down the numbers – you know – the ones who have stuff to do and the ones who have even more important things to do i.e. read this blog on a regular basis. We see that about 50% of the users are “first time users”. This is a little bit deceiving in that the counter relies on IP addresses and cookies to determine whether someone has visited the site before. In case of the latter, situations where browsers do not accept cookies or regularly dump their cookie loads (I don’t understand why one would not want cookies or even worse why you would wanna dump cookies esp. the heart shaped ones! Mmmmmm. Cooooookkiiies) would throw off the actual number while in the former, visitors on dynamic IP’s e.g. the AOL guys or internal company networks would record as “new visitors” even though they had checked out the site several times.
The short: At least 35% of the visitors read this blog on a monthly basis and another 20% read the blog on a biweekly basis.
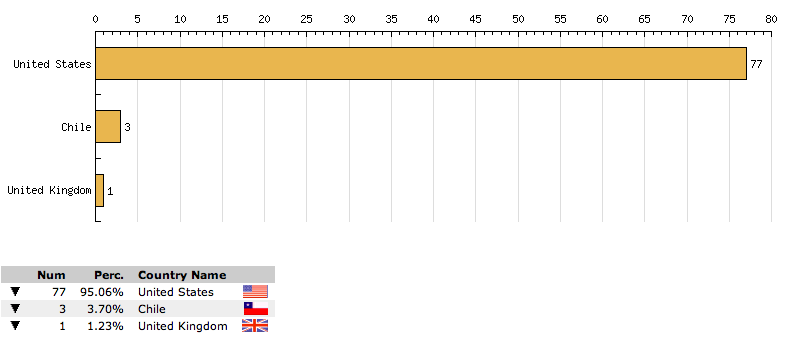
Lastly, we see that we have some good faithfuls over in Chile and in the UK checking out the blog. Power to the world man. If you haven’t bought onto this globalization thing yet … you might just wanna jump on the bandwagon … it’s for real. Trust me. The previous months have recorded visits from France, Japan, Tanzania among others. At the end of the day though, we see that the biggest spender is the San Jose resident commanding a whopping 50% share of the blog traffic. Yay for good old Silicon Valley – After all we are Silicon Valley NSBE Alumni aren’t we?

Enjoy the corny ending and have a great week/ weekend!
2 comments:
Hey, how do you track the hits? Cookies taste really good :)
I use statcounter.com. They have a pretty okay free package ... and yeah ... cookies really do taste nice!
Post a Comment